Website statistics – your source of knowledge about users
How well your website performs can already be seen at first glance, for instance by the number of sales leads. But where does this result come from? What are the weaknesses of your website and what can be optimized?
You can find answers to these and other questions by analyzing user behaviors with the help of website traffic monitoring tools.

Photo by: Marcin Wichary
Tools
In the youthful years of the World Wide Web, when only a few companies had their website, web analytics was limited to a counter placed in the website footer. The value of the counter increased with each visit and displayed the number of visits from website beginnings. In other words, this was more a gadget than a piece of information that could be used in whatever way.
Then webmasters got interested in web server statistics from which you could learn the number of requests, file downloads, page views and visits within a given time period. You could also obtain information about how popular each page was as well as very general data about users.
What’s interesting, I still meet website owners whose knowledge about website traffic is based exclusively on server statistics.
With the Internet gaining in popularity and technology developing, specialized applications to monitor traffic started to appear. From then on it’s enough that you paste a piece of code to your website so that each time the website is viewed an external application collects and saves data about the visit and user. Then you only need to log in to the administration panel of the service provider to generate various reports.
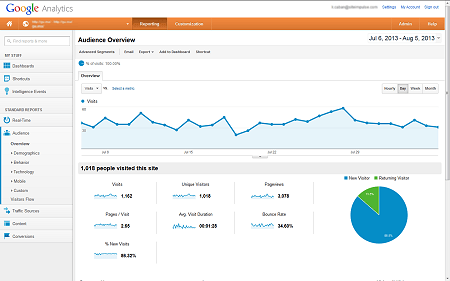
The indisputable leader among web analytics systems is Google Analytics, which is estimated to track nearly 80% of websites all over the world. This is a powerful and at the same time a free (up to 10,000,000 page views a month) tool. One of the reasons behind its popularity is the fact that you are often forced to use it, for example by advertisers.
Although Google Analytics is still being developed there are solutions that are able to provide even more information about users. Google Analytics focuses on pageviews, Mixpanel concentrates on specific events (actions by users) and KISSmetrics lets you monitor particular users (person-centric data).
There are also tools whose data can complete basic statistics. For instance, Crazy Egg is a “heatmap” type mechanism that registers clicks on the page and shows which elements are clicked more often and which less.

Source: Crazy Egg Blog
Following on from this, we come to usability tests of websites that use eye tracking technology, i.e. measure eye movements of sample users with the help of specialized video recorders. But this is a subject for a separate article.
Data
The example of Google Analytics shows what you can learn by analyzing specific pieces of data (data for a selected time range):
Basic values
Visits: how many times users visited the website (total number of visits) – the main measure of website popularity which, anyway, can’t be taken into consideration without the information about the number of users (see below).
Pageviews: how many times pages were displayed (during one visit there may be many pageviews because a user may view a number of pages) – this is a value that shows how much website content is consumed.
Unique visitors: how many users visited the website (one user can make a number of visits) – an important complement to the number of visits helping you assess the popularity of the website.
User behaviors
Pages/visit: how many pages were viewed (on average) per one visit – it illustrates how successful you were at getting the user interested in the content.
Average visit duration: how much time an average user spent on the website – complement to the pages/visit rate that shows whether the user really got to know the website content or only “clicked over” some pages.
Bounce Rate: the percentage of visits finished after a short time without moving to other pages of the website – this is a measure of traffic quality, i.e. how many users were the target users of the website.
% New Visits: how many of the visits were made by users that were first-time visitors to the website – if this rate is high it means loyalty among users is
low because only few of them come back to the website.
Frequency & Recency: the number of users with the number of times they come back to the website – detailed complement to the new visits rate.
Engagement (duration and depth): the number of users with the amount of time they spent on the website and with the number of pages they viewed – expansion of the average visit duration and the pages/visit rate.
Visitors flow: popularity of different paths the users take when browsing the website – if you know from where and to where the users move you can optimize the website architecture in such a way that they end up in a place you exactly want.
Demographic information
Website visitors are largely anonymous (I ignore those who register and log in). As far as demographics are concerned, we may only learn what language they speak and where they were while visiting the website (country and place).
Technology
For technical optimization of the website, important information can be found in such data as: operating system used, browser type and version, screen resolution, device type (desktop/tablet/smartphone) and also, in the case of mobile devices, device producer and model.
Sources of visits
A very important piece of information is where the traffic on the website comes from, i.e. where the users come from.
Generally speaking, visits to the website may come from the following sources:
- direct traffic – when a user opens the website by entering its URL in the browser (or by clicking a URL they find, for example, in an email)
- search traffic – visits after a click on a link in search results (mainly in Google)
- referral traffic – i.e. from links on other websites
- campaigns – traffic from online campaigns for which campaign monitoring was launched (see chapter “Tracking results” in “Anatomy of the landing page, i.e. how to catch the user”).
Traffic from the search network can be analyzed thanks to a list of keywords, although in the last years this has been strongly limited and only in some cases Google gives information about queries entered into the search engine. Other queries (which, unfortunately, comprise the majority) are marked “(not provided)”.
The list of referral websites, however, is provided in full – thanks to that you can clearly see which links brought you the largest number of users.
In the case of campaigns, reports include an analysis of these data that have been provided in the clicked URL’s – most frequently this is the name of the campaign, medium and source of the traffic.
Content
The content attracts users from Google. The content has an influence on the amount of time spent on the website. Finally, the content makes users perform (or not perform) a desired action on the website.
By analyzing how popular individual pieces of content are and looking at the rankings of landing pages (where users land on) and exit pages (where users finish their visit to the website) you obtain valuable information about what the users expect and appreciate.
Conversions
As I wrote at the very beginning, we usually know how well our website performs because this is the most important thing and we care about that (although you may still find companies that don’t reply to queries from their websites…). Analytic software, however, makes it much easier – and additionally it makes it possible to compare information with other data, thanks to which you know what the conversion rate is and what affects it.
Reports also visualize paths that lead the users to conversion – we can see where they most often start viewing the website, which pages they go through and from where they most often reach the form you wish for.
A nice “gadget” is that you can watch traffic on the website in real time – you can take a peek at how many users there are on your website at a given moment and what they exactly do.
Alerts
A very useful functionality that not everyone knows about are email alerts. You can define any number of them and specify conditions such as “if the volume of traffic from the USA decreases by 20%” or “if the bounce ratio is higher than 50%”.
To find alerts in Google Analytics panel go to: Administrator > Account > Profile > Custom alerts.
Advanced analyses
Packages that monitor web traffic – and in particular Google Analytics – offer analysts quite a lot of additional possibilities which require a bit more knowledge or at least more time spent in the panel. They make it possible to monitor e-commerce functions, perform A/B tests and generate various custom reports on the basis of collected data.
There is even an option where you provide Google Analytics with the data about events that cannot be recorded by the traffic monitoring mechanism.
Internet analytics is an entire field of knowledge, which is also very dynamic. In order to make full use of analytic packages and their potential you have to specialize in that and learn new things on a regular basis. That is why website owners more and more often have the reports prepared and, above all, the results interpreted and conclusions drawn by external providers.
Other data sources
For website analytics, external data is of great importance. These could for example be campaign statistics provided by an advertising network or a media house, data from social networking services, statistics of RSS channel users, openings of and clicks on emails etc.
Nobody has to be convinced of how necessary it is to measure traffic on the website. Effectiveness of each tool – and not only a marketing tool – must be controlled.
It’s important to devote some attention to analytics already at the very beginning – to choose good software and make sure that it was installed correctly. If we are certain that data are collected and that we register a lot of information about users we won’t regret that after a few months when a thorough analysis becomes necessary.